Gone with the Wind
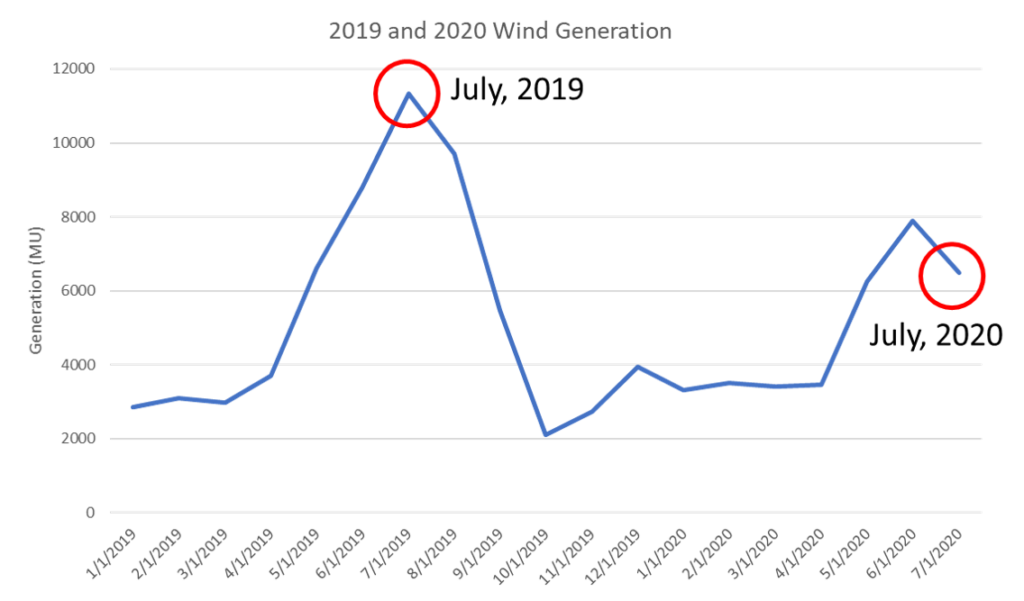
For the month of July, 2020, India’s total wind generation was 43% less than July, 2019. This is despite adding more than 1 GW of new capacity since last year. For the last 3 months, May through July, generation was 31% lower than 2019. This is from Central Electricity Authority data. For the large generating states, Madhya Pradesh, Maharashtra, Andhra Pradesh and Karnataka July’s production drop is more like 50%.
This drop is mostly explained by an extreme wind anomaly that is occurring which has dramatically reduced the normal monsoon winds. While it has been a very wet monsoon, the normal low-level jet, which drives the peak wind generation season just didn’t develop. Cooler temperatures over much of northern India reduced the land / ocean temperature contrast which reduces monsoon circulation. This is explained very well by Dr. Murtugudde in a recent article “Curious Case of Monsoon 2020: A Peek Into Strange Evolution and Progress of This Year’s Monsoon”.
Check it out. It’s quite interesting.
So how strong was this anomaly? To look at this, we used ERA5, to compare long term wind trends to recent months. Here is a map of July anomaly of 10-m wind speeds that illustrates.
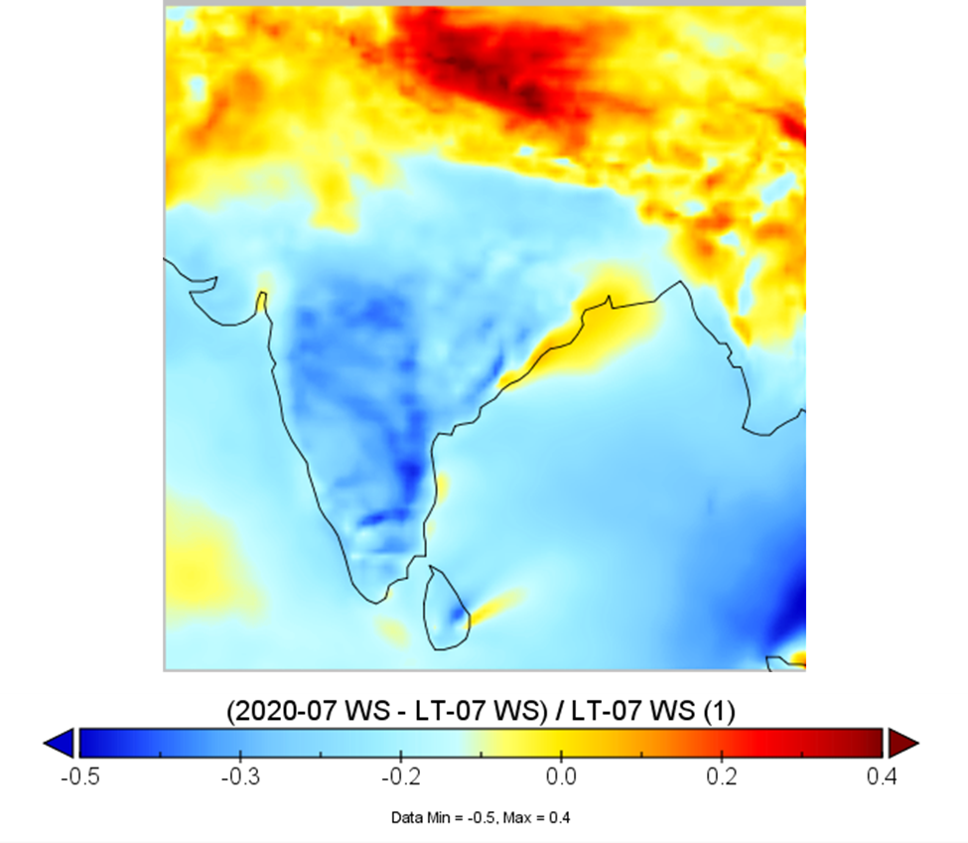
Most of the country experienced 20-40% lower wind speeds than normal. In Rajasthan, the event is less pronounced. Certainly, this countrywide drop has caused very large impacts to portfolios of Indian wind projects.
What is normal?
The first question we must consider is what normal is. We can’t know what an anomaly is unless we understand the baseline. For this, we draw from the art of wind resource assessment. I say it’s an art because there are many things we just don’t know. The often poor quality of old data combined with a dynamic and changing system leaves plenty of room for artful guesswork.
Take for example, Maharashtra annual average wind speeds.
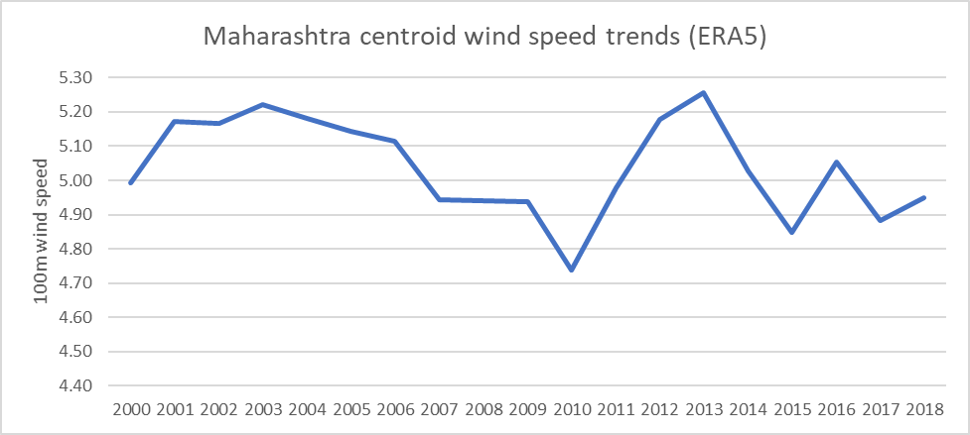
Over the last 20 years, this seems relatively well behaved, but what do we make of the decreasing trend between 2003 and 2010? If we had this data and we were thinking about it with our 2010 hats on, we might be tempted to take the 7-year downward trend and handicap the future. We know now, this would have been wrong. But, we still would have to make a judgement.
A central problem exists in that we often cannot tell the difference between normal climate variability, a climate changing signal and quality issues in our reference data. We are left with the art of choosing the period we define as normal by instinct and hopefully, some statistical tests.
We chose to use data from 2000 forward and called it normal, In Rajasthan, we used 2003 forward. This gives us roughly 20 years of data to evaluate. Here are what these trends look like for the seven large wind generation states.
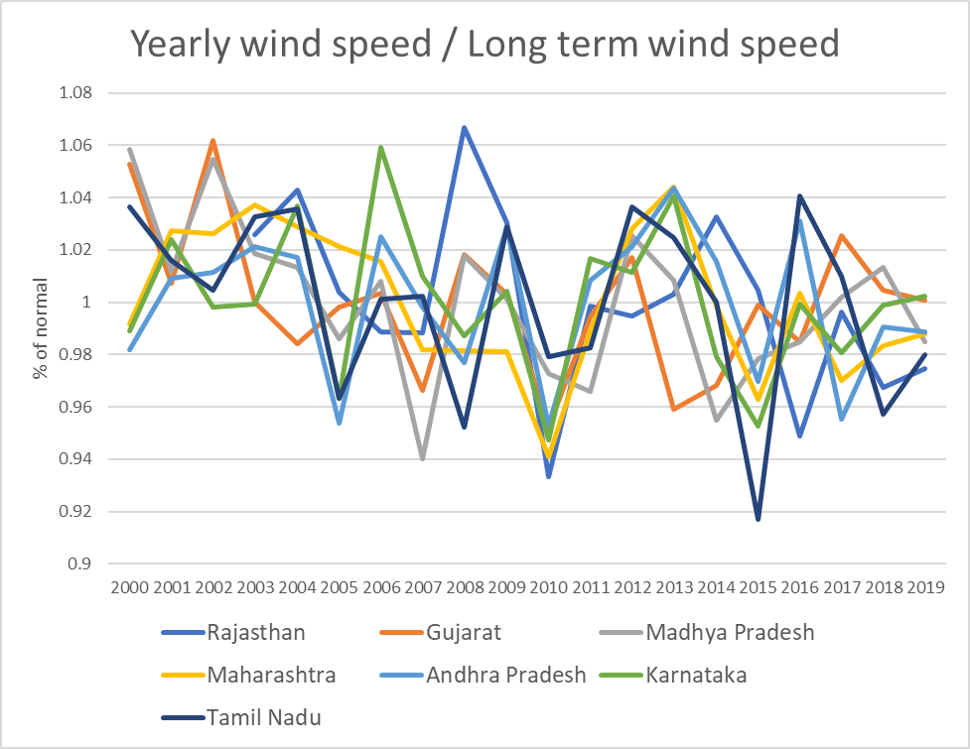
In several of the data sets, especially the more northern states, an argument can be made that even more recent periods, perhaps the last 10-15 years is a better definition of normal. But, for this analysis, we wanted a large enough sample to draw reasonable estimates of variance from. This is needed for calculating probabilities associated with wind anomalies.
It turns out that the conclusions aren’t that sensitive to what our definition of normal is. A main result is that whatever normal is, the 2020 Indian monsoon is not that.
Results
Here are the conclusions looking at July, 2020.
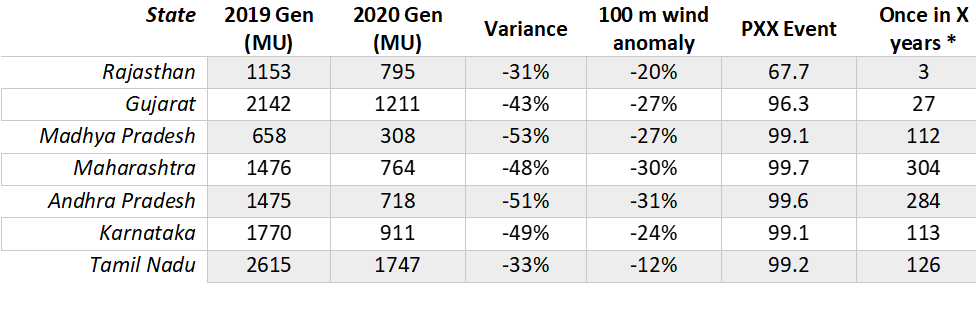
What jumps out is that the large drop in July wind speeds is an extremely rare event. With the exception of Rajasthan, July 2020 was the lowest winds on record for at least the last 20 years. For states outside of Rajasthan and Gujarat, departure from normal was 2.5 standard deviations, or worse than the P99 event.
In the above table, the PXX column shows probability of exceedance calculations. This calculation tells us the odds that normal conditions are better than what happened. A P99 event means there is 99% chance that things are better. Another way to think about this is that a P99 event has a 1% chance of happening and can be called the 1 in 100 year event. That calculation is shown in the last column.
As example, take Andhra Pradesh from our ERA5 derived wind index.
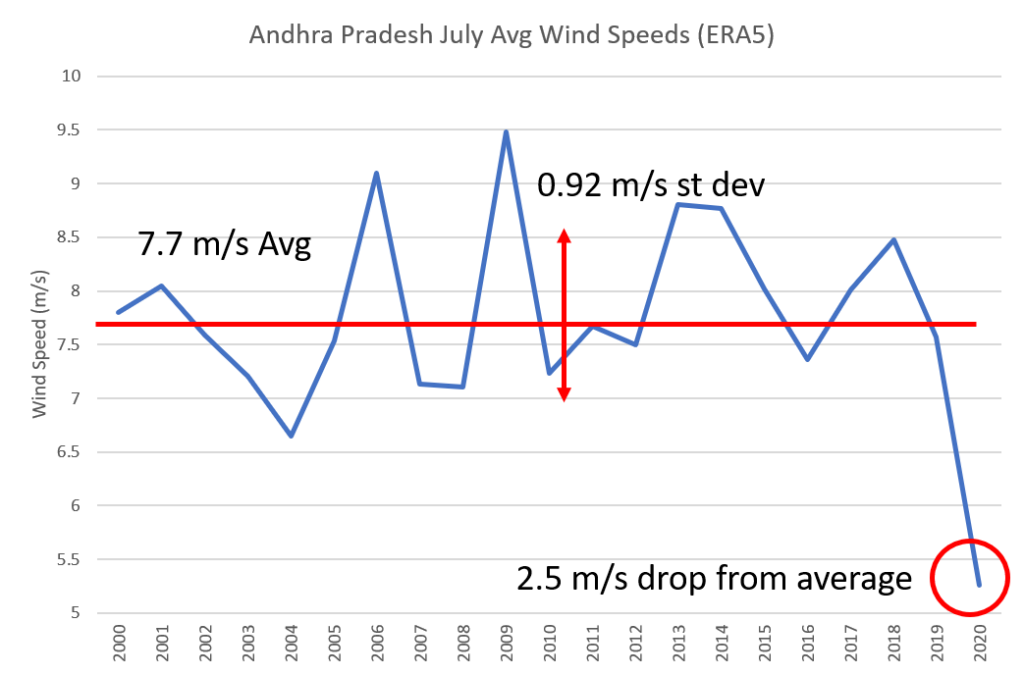
With a 20-year standard deviation of 0.92 m/s, a drop of 2.5 m/s is very extraordinary. Statistically, a P99.6 event. If statistics are correct, something that would happen once in 284 years. I should mention that extreme event analysis is very difficult and these calculations should be taken with a grain of salt. But, however you spin it… it looks pretty extreme.
The same analysis was done for the three months ending in July 2020.
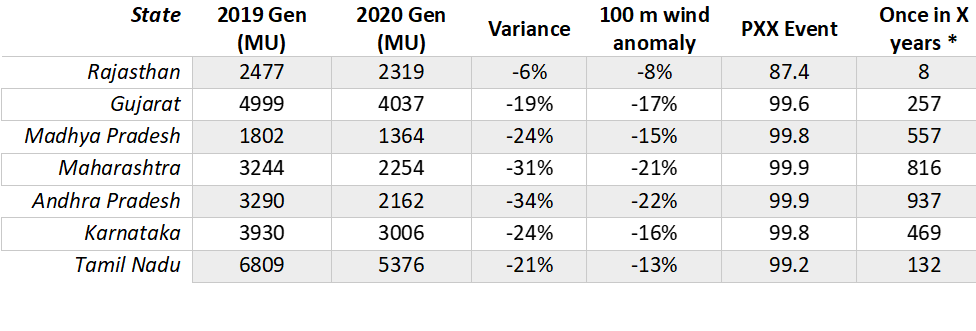
These results show that this extreme event has been building for the last few months. In AP, can we say this is a once in 937 year event?? I hesitate to say that, but its very dramatic indeed.
What does this mean for the future?
There is no doubt that this is significant. The follow-on question is always asked about what this means for the future. This is where it gets tricky. On one hand, we have to rely on established practices. We usually have confidence that weather systems have natural variability to them that revert to established means. This is a basic principle in wind resource assessment. Climate doesn’t change that rapidly. But, they always say that past performance does not guarantee future results. We must acknowledge that climate patterns drift and change. This is a hot topic in renewables where fuel is derived from the weather. Dr. Murtugudde, in the linked article mentions that an increase in average temperatures of the Indian ocean over time will impact monsoonal patterns. This event is too extreme to call it a new normal. But, it is a good reminder to be diligent and keep looking at the science behind what’s happening and make sure its properly considered. I said before that wind resource assessment can be an art… But, we can’t forget about the science.
We don’t know with certainty what the future of winds in India will be. We have to rely on the past to predict the future. Statistically, variability should even out and India is due for some some massively good wind. But let’s all pay attention to events like this while managing interest of investors in wind.
What do the data of column in ” once in X years ” actually represent ?
Hi Vasishta. I tried to describe this in the 3rd paragraph of Results section. Here is how you read the table, taking Gujarat data in Table 1. The 17% drop in wind represents the P96.3 event. In other words, there is a 96.3% chance winds in July should be better or otherwise this drop (or worse) has a 3.7% chance of occurring. For something with 3.7% chance of occurring each year we would expect it to happen once every 27 years. (1/0.037).
Excellent and very timely article indeed!
Many thanks.
I would request to calculated rolling average of 5 years block for 25 years. In my understanding apart from this extreme lower winds, there is a constant drifting in lower side.
Yes WRA is art and needs to perfected to facilitate business decisions in a rightful manner.
One again….Thank you both of you for good work!
Regards,
Dinesh Majithia
Hi Dinesh,
Thanks for your interest. This is something I’ve been tracking and observed. I reference what you are talking about when I make this statement – “In several of the data sets, …, an argument can be made that even more recent periods, perhaps the last 10-15 years is a better definition of normal. ”
I’ll send you the 5-year rolling average by email for the data I show in figure 4.
Matt
very nice article
Thanks Babu. I hope it is useful to you.
Matt
Nice article Matt,
This will surely give light on the winds over several years versus 2020. If we refer the Fig 5, 2019 is very close to long term average, whereas Jul 2020 wind are beyond any statistical model to will predict.
How to capture, these events w r t long term wind speed for annual energy production of a wind farms is the challenging. Though these are 1 in 100, statically.
Perhaps these are part of operational of wind farm.
Hi Guruswamy! When we do an operational reforecast, we do take in consideration the windiness of the operational period. We take long term climate signals and attempt to normalize out short term wind conditions. In extreme periods such as this, I don’t expect the normalization to work that well, so hopefully the project in question has a couple years of data to improve the skill of that technique. It is very hard to capture events like this in a predictive sense. And once they happen, it’s hard to incorporate its effect into a long term analysis. But, we do try.
The data should be need to reflect the actuals. Only compare in July certain years are not a right way as per WRA research.
Hi Bengal, Thanks for your comment. The point is that July 2020 is quite low compared to any year (at least in ERA5 data). Comparing 2020 to 2019 is easiest comparison for actual generation because growth in generation due to new installations makes comparison to long term actuals tough.
Indeed a nice informative analytics.
Can we do same for solar irradiation as well?
Thanks
Hi Ankit, Thanks for the comment. I’ve been looking at solar to and hope to have something interesting to say soon.
Excellent article Matt! Can you please send me the 5 year rolling data? Also lets be in touch.
Best Regards
Shantanu Bagchi
Pingback: Indian Wind Generation Improves for August 2020, but Still Low – Hendrickson Renewables
Very nice article and it gave a vast idea too. May be my question is that, we need to rely on past for future prediction; but while doing WRA analysis using past data is that possible to predict future 20 years on month/year basis. Even if we have that prediction what would be the probability we may consider on that predicted data…?
Thanks for commenting! There are two ways to predict the weather; statistically using past data and actual modeling using using some signal that looks forward. Using historical data and statistical analysis you might be able to predict a 10 or 20 year period within 2%, any single year within 5% or any month within 15% or so. (roughly speaking and quite variable around the world). Starting from this and looking at the same time scales, one can only slightly improve the skill of historical analysis by adding some forward looking modeling. It’s a fascinating challenge for sure.
Thanks Abhinav!