Better, but not quite there
Several weeks ago, I discussed the massive drop in 2020 monsoon winds, where significant low wind anomaly negatively impacted July wind generation in India. So how was August? Data from the CEA was just released and here are how things looked.
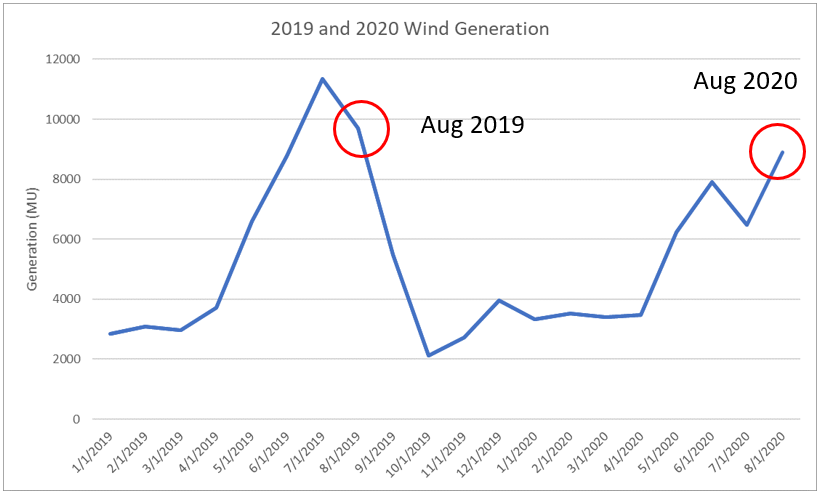
Generation increased 37% from July but was still 8% below 2019 August levels. Statewide generation growth was led by Gujarat, where year-on-year increase was 32%. Rajasthan was flat and all other producing states were down, up to 24% in Andhra Pradesh. On average, lower winds persist. Recall that more than 1GW was added between 2019 and 2020. We would expect 2020 to be higher just for this reason alone.
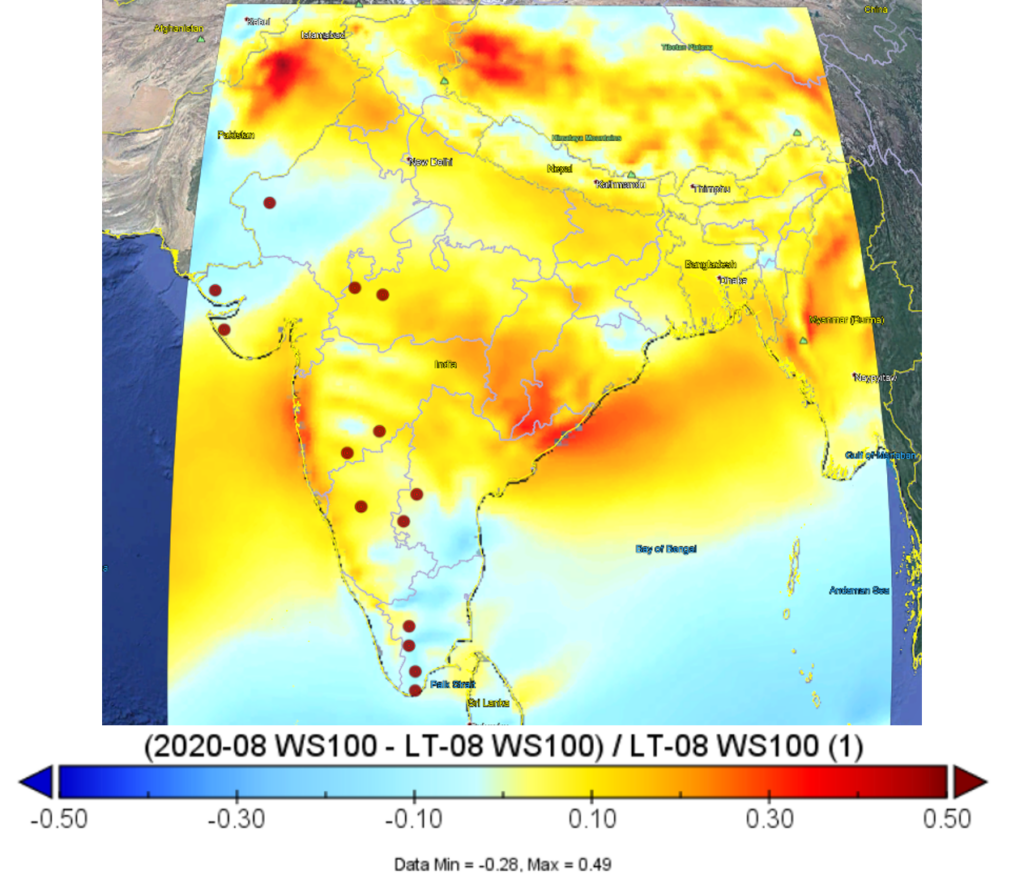
Figure 2 is the wind anomaly map based on ERA5 comparison of August 2020 to the last 20 years. For each state we pulled a centroid where regions of large installations are. These are the red dots shown in the figure.
Why doesn’t wind anomaly match generation anomaly?
In Table 1, are summary results. Generation deviation is comparing August 2020 generation to August 2019 generation as pulled directly from CEA data. Wind deviation is comparing August 2020 winds from ERA5 to the last 20 years of August data. In Rajasthan, we are still comparing the last 17 years. The first observation is that the wind and generation deviations do not match. We would love it if they did. Our world would be easy to explain. Since this is curious, I will highlight several potential explanations as to why this is the case.
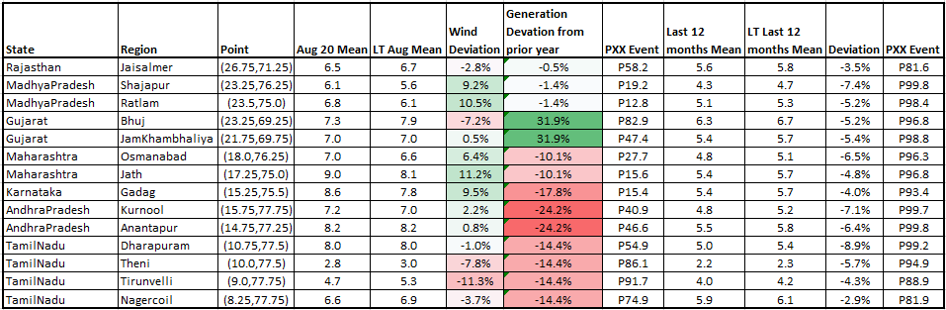
One explanation is that new installations continue to grow capacity. All things being equal, this year’s generation should be larger than last years. Generation for 2020 is much higher than 2019 in Gujarat, but not true anywhere else. It might be that some of this increase is explained by this.
A second reason is that for generation, we are comparing 2020 monthly averages to 2019. This is done for convenience. There is not a long-term generation signal established because of capacity additions. Last year is the easiest, most comparable point. A better comparison could be made if individual project generation data were available.
A third reason, is that the ERA5 anomaly might be wrong. If we were to do a monthly correlation exercise, comparing observed wind to reanalysis-based wind, we might be happy with an r2 of 0.90 which means that 90% of the variance is explained by wind. This implies that 10% is not explained by the signal. This creates error if relied on fully. Making these datasets are complex. We always must be on the lookout for the unexplained, which hint at the imperfection of this type of analysis.
Finally, the data for August from CEA is an estimation, which may differ from actual. I have observed this data can be corrected over time and will change occasionally. Usually, it is only by small amounts.
Looking at the last 12 months
We were curious about the impact the 2020 monsoon had on an annual view. We added a view into the last rolling year. We show this in the last four columns of Table 2. Because of the strong monsoon anomaly this summer, the past 12 months appear to be between the P81 and P99 for each state. Figure 3 is an illustration of this – lots of blue.
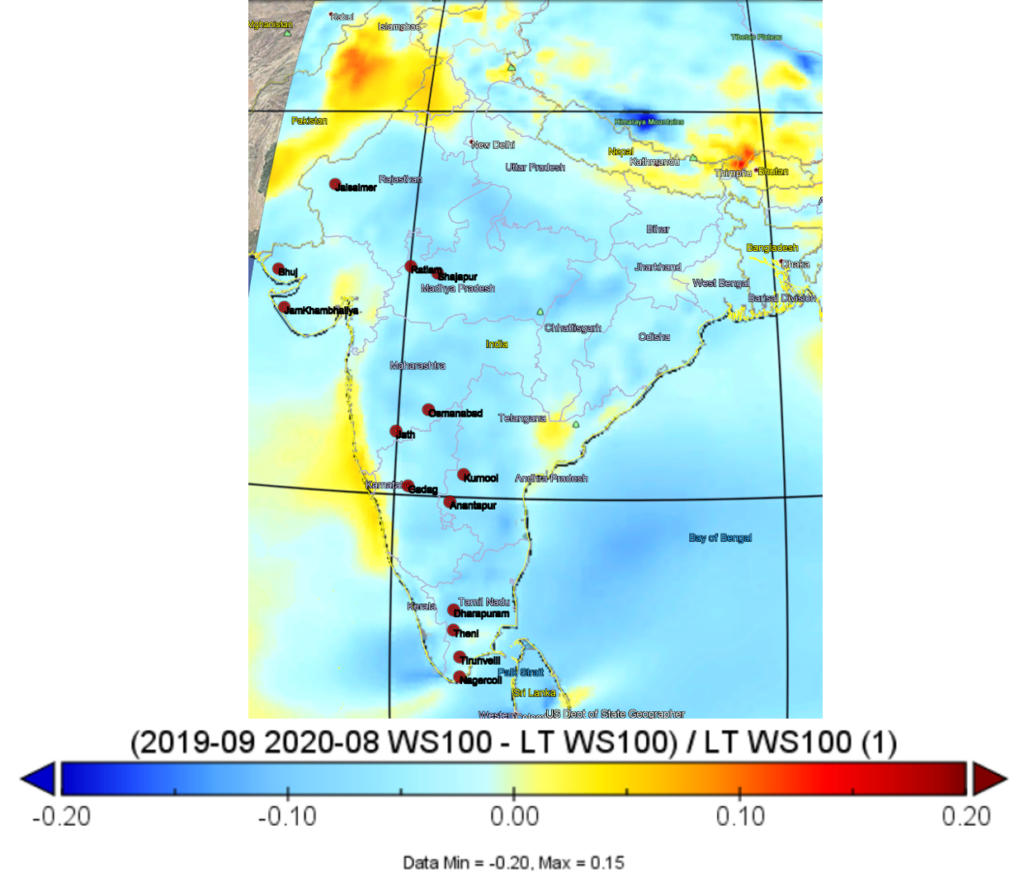
This is a good illustration on how a few bad months in peak generation can impact an entire year. It has been a tough year, but it will get better. Statistically, it has to.
Thank you.
Nice article again and give overall insight.
Quick observation : GJ (Bhuj & Jamkhabaliya) & TN (Tirunelveli & Nagarcoil) little offset in recorded wind speed.
Thanks! I’ll take a look at what you point out.
Really informative ! Thanks for posting this
Thanks Anirudh!